

Image Details
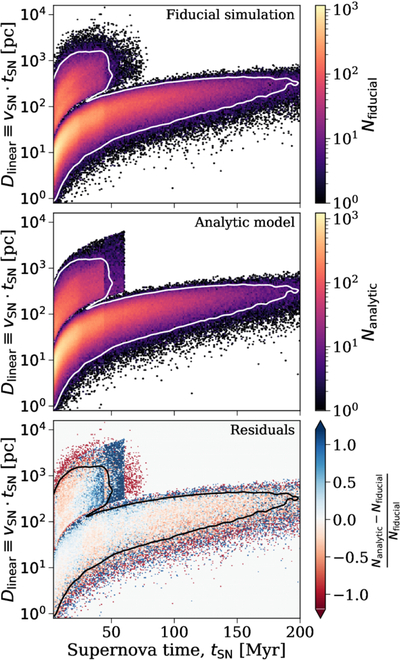
Caption: Figure 11.
A comparison of the joint distribution of our analytic model to the fiducial simulation, which shows good agreement. Each panel shows a 2D histogram with the supernova time on the x-axis and the maximum distance traveled (i.e., the product of the SN time and velocity) on the y-axis. The top panel shows the distribution of the fiducial simulation, while the middle shows the analytic model, and the bottom gives the fractional difference in each bin from the top two panels. The solid contour lines in each panel show the 98% regime for the fiducial simulation.
Other Images in This Article
Show More
Copyright and Terms & Conditions
© 2025. The Author(s). Published by the American Astronomical Society.

Copyright ©
2026 Astronomy Image Explorer. All Rights Reserved.
