Image Details
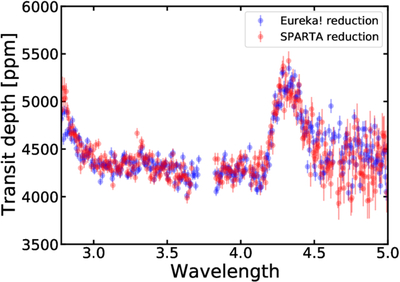
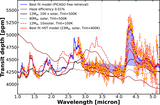
Caption: Figure 4.
Comparison between the transmission spectrum of V1298 Tau b derived from Eureka! (Appendix A) and SPARTA (Appendix B) data reduction. The transmission spectra shown here have been derived using the data-driven light-curve fitting method as discussed in Appendix C.2 applied independently to the Eureka! and SPARTA data reductions. The transmission spectra from both reductions are consistent with each other and show similar molecular absorption features. In NRS1, both data reductions show a similar level of scatter; however, the SPARTA transmission spectrum shows higher scatter in NRS2 compared to Eureka! This is likely due to the slightly higher scatter we found in the NRS2 1D stellar spectra from SPARTA compared to Eureka! and this difference in scatter for the SPARTA reduction is also seen in the white light-curve comparison (Figure C1).
Other Images in This Article
Show More
Copyright and Terms & Conditions
© 2025. The Author(s). Published by the American Astronomical Society.