Image Details
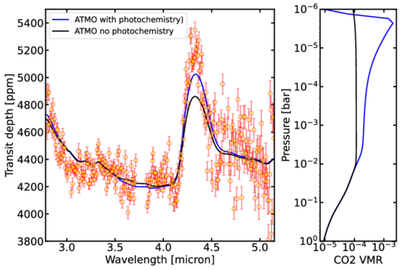
Caption: Figure 6.
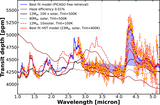
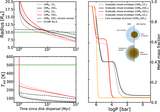
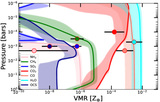
The observed JWST/NIRSpec transmission spectrum of V1298 Tau b (yellow points with 1σ error bars) overplotted with best-fit models from ATMO grids with photochemistry (blue continuous curve) and without photochemistry (black continuous curve), as described in Section 4.2.2. Vertical mixing is included in both grids. The right panel shows their corresponding CO2 VMR profiles. Both models have the same metallicity, C/O ratio, Kzz, and planet mass. The model, including photochemistry, provides a better fit of the CO2 feature. The photochemistry model does not significantly affect the size of the absorption features for other molecules.
Other Images in This Article
Show More
Copyright and Terms & Conditions
© 2025. The Author(s). Published by the American Astronomical Society.