Image Details
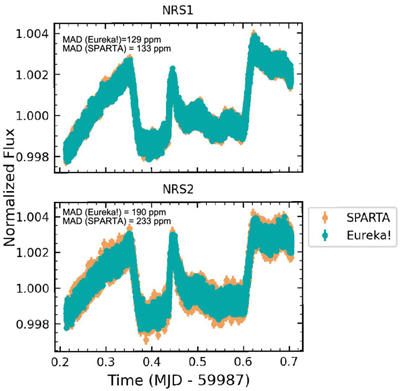
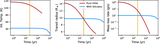
Caption: Figure C1.
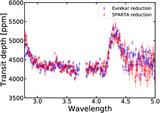
Comparison between white light curves in NRS1 (upper panel) and NRS2 (lower panel) obtained from Eureka! data reduction (Appendix A) and SPARTA data reduction (Appendix B). The light curves and scatter are comparable in NRS1 (129 and 133 ppm for Eureka! and SPARTA, respectively). However, in NRS2, SPARTA shows a comparatively higher scatter (190 and 233 ppm for Eureka! and SPARTA, respectively). Both reductions show qualitatively similar light-curve features: a low-frequency temporal variability signal due to the rotational modulation of spots on the photosphere of the rapidly rotating (2.8 days) young T Tauri star, and high-frequency signal in the middle of the transit, which is due to a flare and prominent postflare oscillations, which continue even after egress, confirming that this periodic variability signal is due to the star and not spot crossings by the planet.
Other Images in This Article
Show More
Copyright and Terms & Conditions
© 2025. The Author(s). Published by the American Astronomical Society.