Image Details
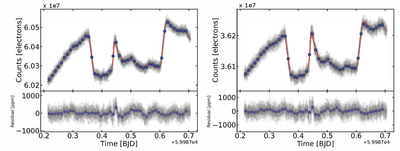
Caption: Figure 1.
Extracted white light curve from the two NIRSpec G395H detectors, NRS1 (left) and NRS2 (right), from the Eureka! data reduction (Appendix A). The upper panel shows the observed counts for each integration (gray points) and the best-fit empirical model (red solid line, see Appendix C). The transit light curves show a large flare in transit followed by postflare oscillations. The baseline also appears curved, which is due to the rotational variability of the young T Tauri host star. The empirical model (Equation (C1)) used to fit the light curves consists of a rotational variability term (quadratic polynomial in time), a double exponential flare model, a sinusoid for the postflare oscillations, and the planet transit modeled using batman (L. Kreidberg 2015). We use a Markov Chain Monte Carlo framework to fit the empirical model to the observed light curve and calculate the best-fit model using median values from the posterior distributions of the fitted parameters. The lower panel shows the residuals obtained by subtracting the best-fit model from the observed white light curve. The residuals show significant structure, indicating that the empirical model fit does not sufficiently account for all the astrophysical systematics.
Other Images in This Article
Show More
Copyright and Terms & Conditions
© 2025. The Author(s). Published by the American Astronomical Society.