Image Details

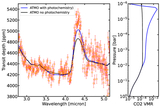
Caption: Figure 3.
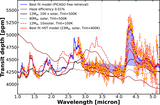
Transmission spectrum of V1298 Tau b observed using JWST/NIRSpec G395H (yellow points), and using HST/WFC3 (S. Barat et al. 2024b; green points), with 1σ uncertainties, along with best-fit model (blue solid) from the free chemistry PICASSO retrieval (see Section 4.1 and Appendix D). The JWST spectra and their 1σ error bars have been derived from the Eureka! data reduction (Appendix A), using data-driven flare corrected light-curve fitting methods (Appendix C.2). The HST spectra have been offset by a 400 ppm to adjust for the difference in brightness level of the star between the two epochs estimated from ground-based photometric long-term monitoring (Appendix G). The transmission spectrum shows a mostly clear atmosphere with a large-scale height (∼1500 km). The contribution from H2O (30σ), CH4 (6σ), CO2 (35σ), CO (10σ), and the continuum opacity (gray clouds) are apparent from the PICASSO free retrieval and are shown with the colored shaded regions. In the bottom panel, we show the residuals (scaled with the error bar on each bin) between the combined JWST and HST observations with the best-fit PICASSO free chemistry model. In the HST bandpass, NRS1 and NRS2, the rms residual is 47 ppm, 55 ppm, and 78 ppm, respectively. The gray shaded region in the lower panel shows the 1σ confidence region.
Other Images in This Article
Show More
Copyright and Terms & Conditions
© 2025. The Author(s). Published by the American Astronomical Society.