Image Details
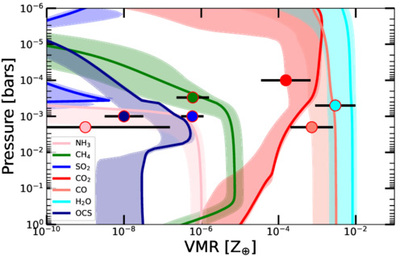
Caption: Figure 10.
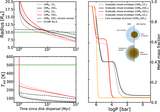
Comparison between retrieved abundances of molecules in our free chemistry PICASSO retrieval (Appendix D), shown with colored circles and 1σ uncertainties, with molecular abundance profiles (solid lines of the same color) from the best-fit self-consistent PICASSO grid model (Appendix E). The shaded region around each profile from our grid represents the range of abundance profiles in the grid models, which have a probability of p(x) ≥ 1% (3σ confidence region). In our case, this represents the top 61 best-fitting grid models. Although the free retrieval finds SO2, the best-fit grid model does not seem to have a large SO2 abundance. The grid predicts OCS, which is also found in the free retrievals but at a 3σ lower VMR than predicted by the grid.
Other Images in This Article
Show More
Copyright and Terms & Conditions
© 2025. The Author(s). Published by the American Astronomical Society.