Image Details
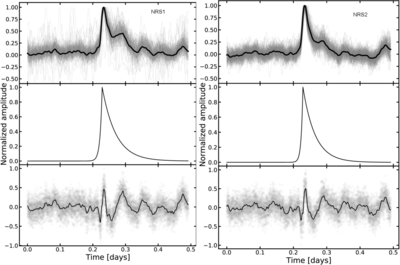
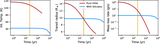
Caption: Figure C3.
Upper panel: spectroscopic light curves of V1298 Tau b derived from the Eureka! data reduction (Appendix A) with the best-fit planetary transit and polynomial baseline removed (gray lines). These light curves have been derived by fitting the spectroscopic light curves with an empirical model (Equation (C1)) described in Appendix C. Subsequently, the observed spectroscopic light curves were divided by the best-fit planetary transit model and the quadratic baseline model, effectively leaving behind the astrophysical systematics (flare and oscillations). The light curves have been normalized at the peak of the flare for visual comparison. The light curves for all spectroscopic channels show similar temporal behavior, i.e., we do not see any wavelength-dependent temporal stretching. The solid black lines show the median of the individual flare-only light curves. Middle panel: best-fit flare model from white light-curve fits. The flare model is derived from Equation (C2) using the best-fit flare parameters from the white light-curve fits. This profile has been used in a second iteration fit to the spectroscopic light curves as described in Appendix C.2) Lower panel: residual oscillation profile from white light-curve fit. The residual oscillations are derived from the white light curves by removing the transit, baseline, and the best-fit flare model (middle panel). The solid black line shown in the lower panels has been derived by applying a Gaussian filter to the observed residual oscillation (gray points). The median residual oscillation profile has been used to detrend the spectroscopic light curves by multiplying with a scaling factor in a second iteration data-driven fit, as discussed in Appendix C.2.
Other Images in This Article
Show More
Copyright and Terms & Conditions
© 2025. The Author(s). Published by the American Astronomical Society.