Image Details
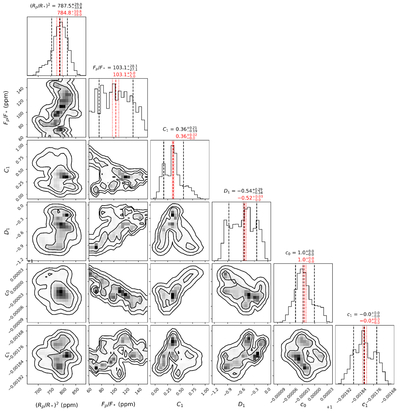
Caption: Figure 22.
Posterior distributions of fitted parameters from the NRS1 white light curve analysis. As discussed in Section 3.3.3, we performed the prayer-bead method on the Eureka! reduction with MCMC, resulting in 4370 values of median and ±1σ. We then re-created 4370 Gaussian distributions using these medians and ±1σ, each with 1000 points, and plotted the 1σ, 2σ, and 3σ contours of the distributions on this figure. The median and ±1σ of the distributions are shown with black dashed and dotted lines, while the original results from Eureka! analysis are shown with red lines. Clearly, the prayer-bead analysis provides us with larger error bars, thus avoiding underestimations of the true uncertainties.
Other Images in This Article
Show More
Copyright and Terms & Conditions
© 2025. The Author(s). Published by the American Astronomical Society.