Image Details
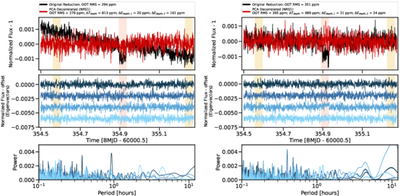
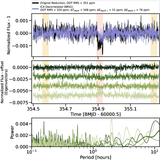
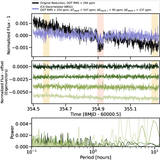
Caption: Figure 21.
Results of the PCA for NRS1 (left three panels) and NRS2 (right three panels). We created 20 independent eigenvectors using the PCA functionality in scikit-learn. We show the results for a single spectroscopic channel (λcen = 4.143 ± 0.017). Top: black is the reduced spectroscopic light curve. Red is the light curve after it has been correlated against the four “best” eigenvectors, shown in the middle panel. Bottom: results of the Lomb–Scargle periodogram on the four eigenvectors in the middle plot.
Other Images in This Article
Show More
Copyright and Terms & Conditions
© 2025. The Author(s). Published by the American Astronomical Society.
Copyright ©
2025 Astronomy Image Explorer. All Rights Reserved.