Image Details
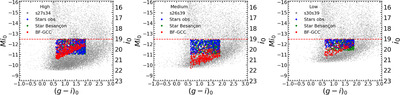
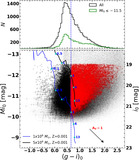
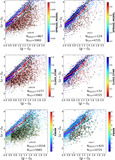
Caption: Figure 9.
Contaminants estimation in the i0 vs. (g − i)0 CMD in three selected fields, which have high (left), medium (center), and low (right) crowding. The cloud of black small dots is all of the detections in each pointing. Blue circles are the observed stars (sources with CLASS_STAR > 0.90), green circles are the expected stars from Besançon models (A. C. Robin et al. 2003), and red circles are the BF-GCC. Red dashed line represents the bright selection limit in magnitude, which is estimated using the turnover of the GCLF (see Section 4.2).
Other Images in This Article

Show More
Copyright and Terms & Conditions
© 2025. The Author(s). Published by the American Astronomical Society.
Copyright ©
2026 Astronomy Image Explorer. All Rights Reserved.