Image Details
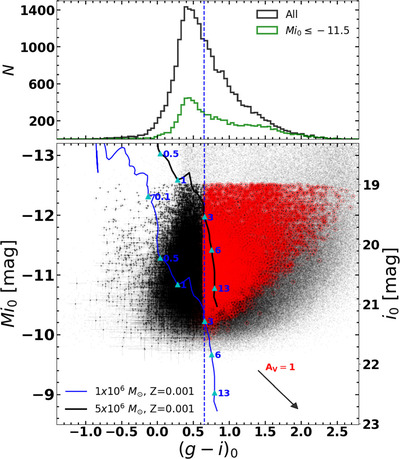
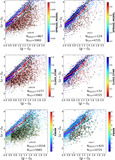
Caption: Figure 6.
Top panel: color histogram of cluster candidates. The black line shows the color distribution over the entire range of magnitudes, whereas the green histogram shows the distribution for bright (﹩{M}_{{i}_{0}}\,\leqslant \,﹩−11.5 mag) clusters. The blue dashed vertical line at (g − i)0 = 0.65 mag separates foreground stars, background galaxies, and young cluster candidates from GCs. Bottom panel: ﹩{M}_{{i}_{0}}﹩ vs. (g − i)0 CMD of all cluster candidates in the 106 Fornax pointings. Sources having (g − i)0 ≥ 0.65 mag are GC candidates (red small open circles), bluer objects are foreground stars, background galaxies, and young cluster candidates (black points), and all of the detections are represented by a cloud of gray dots. The evolutionary locus of the single stellar population (SSP) models from G. Bruzual & S. Charlot (2003) for a single metallicity Z = 0.001, two values of masses of 1 × 10⁶ ﹩{{ \mathcal M }}_{\odot }﹩ (blue solid line) and 5 × 10⁶ ﹩{{ \mathcal M }}_{\odot }﹩ (black solid line), and a Kroupa initial mass function (IMF), are shown. Locations corresponding to ages of 0.1, 0.5, 1, 3, 6, and 13 Gyr are depicted with cyan triangles in each SSP. The chosen color cut separates clusters older than 3 Gyr from the younger ones for unreddened SSPs. The reddening vector with AV = 1 mag is represented by the black arrow.
Other Images in This Article

Show More
Copyright and Terms & Conditions
© 2025. The Author(s). Published by the American Astronomical Society.