Image Details
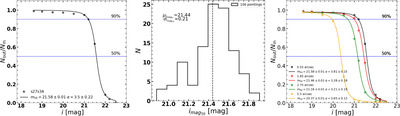
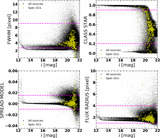
Caption: Figure 5.
Left panel: example of one completeness curve in the i band for the s27s34 field. The horizontal blue dashed line represents the completeness at the 50% and 90% levels. Center panel: distribution of i﹩{}_{{\mathrm{mag}}_{50}}﹩ magnitudes recovered for all of the Fornax pointings. The vertical black dashed line represents the mean value of the distribution. Right panel: completeness tests for mock sources with different Gaussian profile sizes: ﹩0\mathop{.}\limits^{^{\prime\prime} }55﹩ (black curve), ﹩1\mathop{.}\limits^{^{\prime\prime} }65﹩ (red curve), ﹩2\mathop{.}\limits^{^{\prime\prime} }75﹩ (green), and ﹩5\mathop{.}\limits^{^{\prime\prime} }5﹩ (yellow curve).
Other Images in This Article

Show More
Copyright and Terms & Conditions
© 2025. The Author(s). Published by the American Astronomical Society.