Image Details
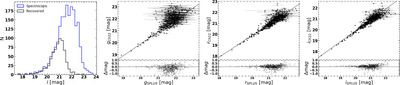
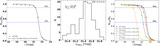
Caption: Figure 3.
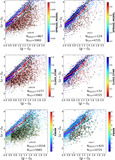
First panel to the left: i-band magnitude distribution of the GC spectroscopic sample from the literature (blue histogram) and GCs recovered with S-PLUS (black histogram). From left to right, we show Fornax GCs PSF magnitude comparison in the g band (second panel), r band (third panel), and i band (fourth panel). In the last three panels, we show the S-PLUS GC magnitudes vs. the spectroscopic GC magnitudes (A. Chaturvedi et al. 2022). The black solid line in the top panels is the identity line, while the black dashed lines in the bottom panels mark where the differences between magnitudes (Δmag = SPLUS − Ch22) are equal to zero.
Other Images in This Article

Show More
Copyright and Terms & Conditions
© 2025. The Author(s). Published by the American Astronomical Society.