Image Details
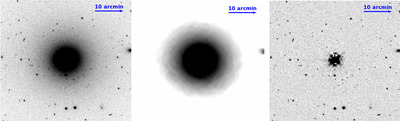
Caption: Figure 2.
Example of the subtraction of the light profile of the galaxies. Left panel: S-PLUS g-band image of NGC 1399. Center panel: galaxy model. Right panel: residual image. All images are aligned such that north is up and east is to the left.
Other Images in This Article

Show More
Copyright and Terms & Conditions
© 2025. The Author(s). Published by the American Astronomical Society.
Copyright ©
2026 Astronomy Image Explorer. All Rights Reserved.