Image Details
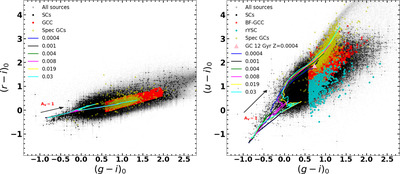
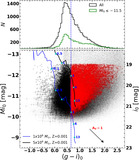
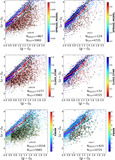
Caption: Figure 7.
Left panel: color–color diagram (r − i)0 vs. (g − i)0 of all cluster candidates (SCs, black dots). Sources having (g − i)0 ≥ 0.65 mag and −0.10 mag ≤ (r − i)0 ≤ 0.70 mag are considered GC candidates (GCC, red dots). The chosen color cut separates clusters older than 3 Gyr from the younger ones for unreddened SSPs. Right panel: color–color diagram (u − i)0 vs. (g − i)0 showing the u-selected cluster candidates (SCs). Objects displaying (g − i)0 ≥ 0.65 mag are GC candidates (BF-GCC, red dots), and bluer objects are possible young star cluster candidates (rYSC, black dots). The bluest color that a classical GC can have (corresponding to Z = 0.0004 and to an age of 12 Gyr) is marked by a rose solid triangle ((g − i)0 ∼ 0.6 and (u − i)0 ∼ 1.9). The reddened young star clusters that displays colors typical of GCs are contaminants and are identified by open cyan circles. In both panels: the reddening vector with AV = 1 mag is represented by the black arrow. The evolutionary loci of SSPs from G. Bruzual & S. Charlot (2003) for different metallicities using a Kroupa IMF are shown by solid curves of different colors, following the color notation shown in each panel. The spectral GCs (spec-GC) are depicted by yellow circles.
Other Images in This Article
Show More
Copyright and Terms & Conditions
© 2025. The Author(s). Published by the American Astronomical Society.