Image Details
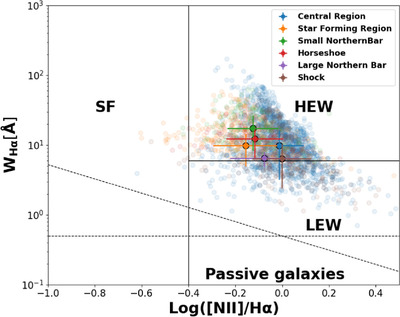
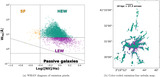
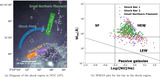
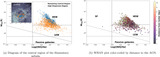
Caption: Figure 6.
WHAN plot divided by structures. We show the ensemble of points color coded to each structure studied in detail in Section 4.2. For each structure, the mean value with a 1σ error is superimposed on the data points.
Other Images in This Article
Show More
Copyright and Terms & Conditions
© 2025. The Author(s). Published by the American Astronomical Society.
Copyright ©
2026 Astronomy Image Explorer. All Rights Reserved.