Image Details
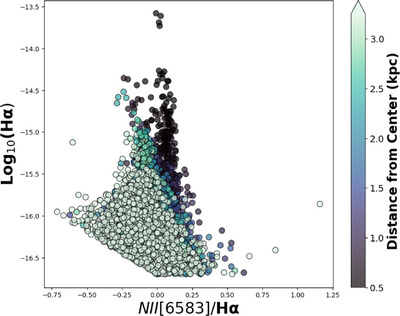
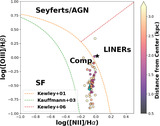
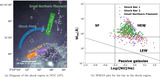
Caption: Figure 5.
Emission-line diagram showing the relationship between log([N II]/Hα) and log(Hα) as a function of the distance from the AGN (designated here at the center) in kiloparsec. The central 0.5 kpc have been excised to remove any issues pertaining to multiple emission lines.
Other Images in This Article
Show More
Copyright and Terms & Conditions
© 2025. The Author(s). Published by the American Astronomical Society.
Copyright ©
2026 Astronomy Image Explorer. All Rights Reserved.