Image Details
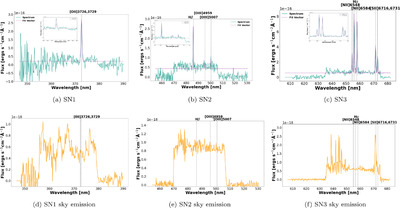
Caption: Figure 2.
Illustrative SN 1 (a), SN 2 (b), and SN 3 (c) spectra (blue) and corresponding fit (purple). The spectrum is integrated from a square region containing 9 pixels (3 x 3 bin) centered at (3:19:49.7, +41:30:45.4) corresponding to the left-hand side of the central region. The x-axis has been shifted by the redshift of NGC 1275. The bottom row shows the SN 1 (d), SN 2 (e), and SN 3 (f) sky emission spectra (orange). Here, the spectrum is integrated from a circular region centered at (3:19:42.4979, +41:32:01.810) with a radius of 9﹩\mathop{.}\limits^{\unicode{x02033}}﹩6.
Other Images in This Article
Show More
Copyright and Terms & Conditions
© 2025. The Author(s). Published by the American Astronomical Society.
Copyright ©
2026 Astronomy Image Explorer. All Rights Reserved.