Image Details
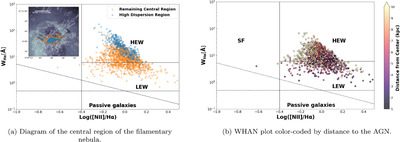
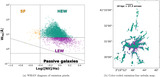
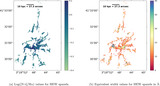
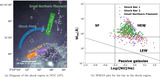
Caption: Figure 10.
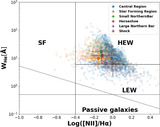
The left panel is a diagram of the central region of the filamentary nebula in NGC 1275. The background image is the Chandra soft X-ray emission, while the white contours highlight the Hα emission. We partition the central region into the high dispersion region as initially discovered in B. Vigneron et al. (2024) and the remaining pixels. We show the WHAN diagram for the high dispersion component (blue) and the remaining spaxels in the central region (orange). The right-hand panel shows the WHAN plot color coded by distance to the AGN.
Other Images in This Article
Show More
Copyright and Terms & Conditions
© 2025. The Author(s). Published by the American Astronomical Society.
Copyright ©
2026 Astronomy Image Explorer. All Rights Reserved.