Image Details
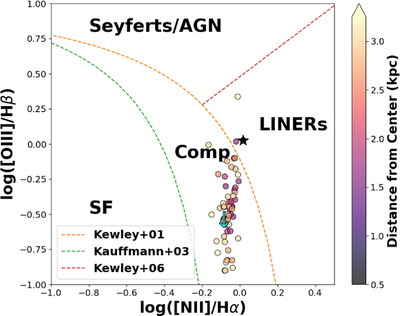
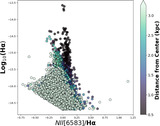
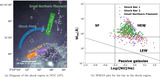
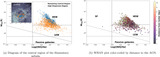
Caption: Figure 4.
BPT diagram showing log([N II]λ6583/Hα vs. log([O III]5007/Hβ) in the central region of NGC 1275. The points are color coded by their distance to the AGN at the center of NGC 1275. The cyan arrow represents the upper bound of the brightest pixel in the small northern filament. The AGN is marked by a black star. We overplot the L. Kewley et al. (2001, hereafter K01; purple), K03 (orange), and K06 (blue) diagnostic lines. The region between the K01 and the K03 lines is considered a composite region. Spaxels falling in the composite region are considered to be ionized by multiple types of ionizing sources with a range of characteristic average energy per ionization particle or photon.
Other Images in This Article
Show More
Copyright and Terms & Conditions
© 2025. The Author(s). Published by the American Astronomical Society.