Image Details
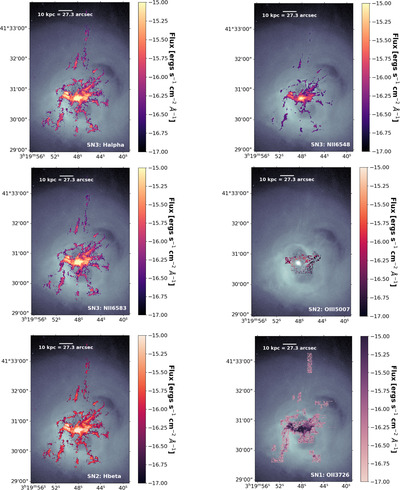
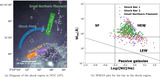
Caption: Figure 3.
Masked flux maps for each emission line in SN 3, SN 2, and SN 1: Hα, [N II]λ6548, [N II]λ6583, [O III]λ5007, Hβ, [O II]λ3726+[O II]λ3729. The calculated flux maps are masked below a SNR of 3 and a flux cut at 1 × 10⁻¹⁷ erg s−1 cm−2 Å−1. Remaining noisy pixels were removed manually using ds9. In the background, we display the exposure-corrected, background-subtracted, merged Chandra image. The images are aligned to approximately 0﹩\mathop{.}\limits^{\unicode{x02033}}﹩7.
Other Images in This Article
Show More
Copyright and Terms & Conditions
© 2025. The Author(s). Published by the American Astronomical Society.
Copyright ©
2026 Astronomy Image Explorer. All Rights Reserved.