Image Details
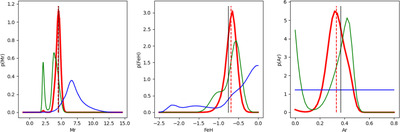
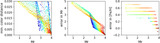
Caption: Figure 10.
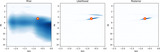
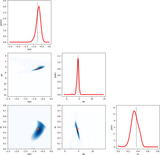
An illustration of the improvement in the “knowledge” of model parameters between the prior and posterior, brought by measurements via the likelihood map. The lines show marginal distributions produced with the prior (blue), likelihood (green), and posterior (red) maps from Figure 8. The dashed line shows the expectation value for the marginalized posterior and the vertical solid line marks the true input value.
Other Images in This Article
Show More
Copyright and Terms & Conditions
© 2025. The Author(s). Published by the American Astronomical Society.
Copyright ©
2026 Astronomy Image Explorer. All Rights Reserved.