Image Details
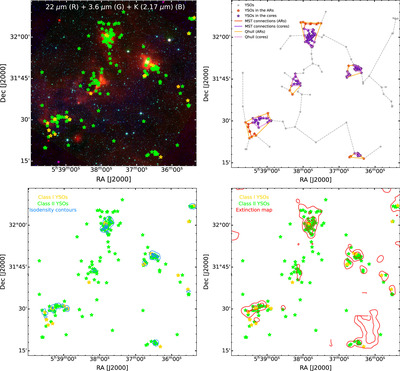
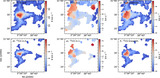
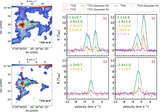
Caption: Figure 12.
Upper left panel: Color-composite image (red: WISE 12 μm; green: Spitzer 3.6 μm, and Blue: 2MASS K-band 2.17 μm) of the region overlaid with the locations of identified YSOs (Class I (yellow asterisk) and Class II (green asterisk)). Upper right panel: Representation of MST connections in the cluster (orange) and core (purple) along with the locations of identified YSOs (orange asterisks for the YSOs in the cores and purple asterisks for the locations of YSOs in clusters). The extracted clusters/cores are also enclosed by the Convex hulls using yellow and purple line segments, respectively. Black asterisks also mark the locations of all the identified YSOs. Lower left panel: Surface density map of all stellar sources. Lower right panel: Extinction map overlaid with the locations of identified YSOs (Class I (yellow asterisk) and Class II (green asterisk)). The lowest contour level for the generation of the surface density map is 1 YSO arcmin−2 with a step size of 29.5 stars arcmin−2, whereas for the extinction map, it is 2.7 mag with a step size of 1.92 mag.
Other Images in This Article
Show More
Copyright and Terms & Conditions
© 2024. The Author(s). Published by the American Astronomical Society.