Image Details
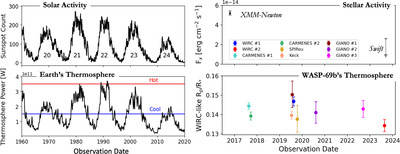
Caption: Figure 6.
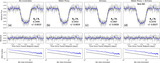
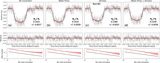
Summary of comparative aeronomy between the terrestrial thermosphere and WASP-69 b. Left: time series of solar activity indicator (top panel) and terrestrial thermospheric conditions (bottom panel) from 1960 to 2020. Numbers on the top panel label the solar cycles by their numbers. Right: analogous plots for the WASP-69 system. The top panel shows stellar activity proxied by X-ray flux observed at Earth, and the bottom panel shows WASP-69 b’s thermospheric conditions as traced in metastable HeI from Section 3.3. Multiepoch, multiwavelength campaigns are necessary to extend the well-developed field of solar system aeronomy to the exoplanets.
Other Images in This Article
Show More
Copyright and Terms & Conditions
© 2024. The Author(s). Published by the American Astronomical Society.