Image Details
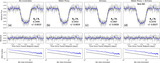
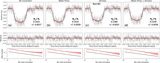
Caption: Figure 2.
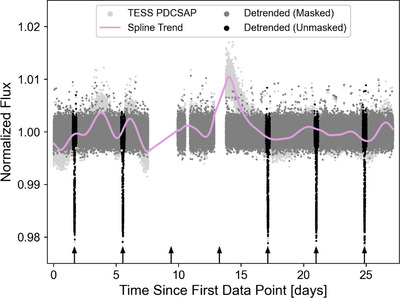
Photometry of WASP-69 from TESS Sector 55. The lightest gray points are the PDCSAP flux that were downloaded from MAST, and the magenta line shows the best-fit spline from Keplerspline. Detrended flux, obtained by dividing the PDCSAP flux by the spline, is shown with two colors. Dark gray dots are detrended points far from the observed transits that are removed by the mask. Black dots are detrended points that are included by the mask. Upward-pointing arrows indicate expected transit midpoints from orbital parameters published by Kokori et al. (2022).
Other Images in This Article
Show More
Copyright and Terms & Conditions
© 2024. The Author(s). Published by the American Astronomical Society.
Copyright ©
2026 Astronomy Image Explorer. All Rights Reserved.