Image Details
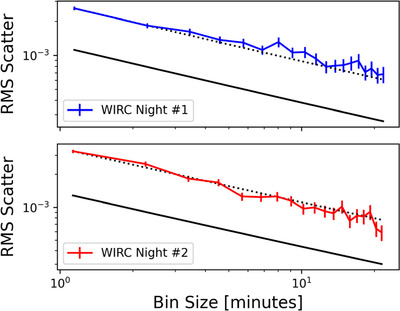
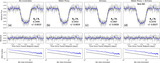
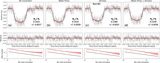
Caption: Figure 4.
Allan deviation plots for each detrended WIRC light curve in the joint fitting with both time series and TESS data. The top and bottom panels show results from the detrended night 1 and night 2 light curves, respectively. Colored lines with error bars denote the rms error of the binned residuals for each light curve. The solid black lines denote the expected noise from purely Poisson statistics, and the dotted line shows the photon noise scaled up to the rms error of the binned residuals.
Other Images in This Article
Show More
Copyright and Terms & Conditions
© 2024. The Author(s). Published by the American Astronomical Society.
Copyright ©
2026 Astronomy Image Explorer. All Rights Reserved.