Image Details
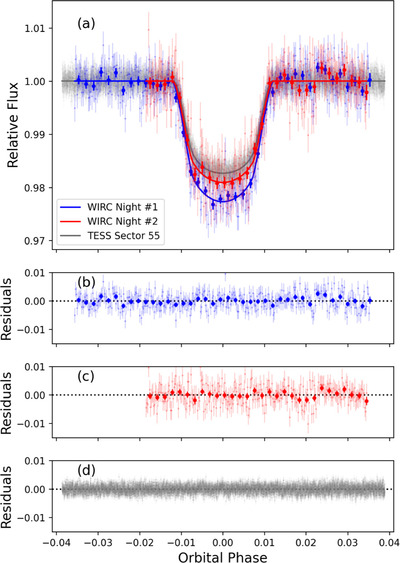
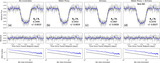
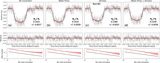
Caption: Figure 3.
Results from joint fitting WIRC night 1 (blue), WIRC night 2 (red), and TESS (gray) data. Panel (a) shows the phase-folded light curves for all three time series. Individual points and their uncertainties are shown with small markers, and Palomar/WIRC data binned to 10 minute intervals are shown with larger markers. Best-fit light-curve models are shown as solid lines. Panels (b), (c), and (d) show the residuals for the WIRC night 1, WIRC night 2, and TESS time series, respectively.
Other Images in This Article
Show More
Copyright and Terms & Conditions
© 2024. The Author(s). Published by the American Astronomical Society.
Copyright ©
2026 Astronomy Image Explorer. All Rights Reserved.