Image Details
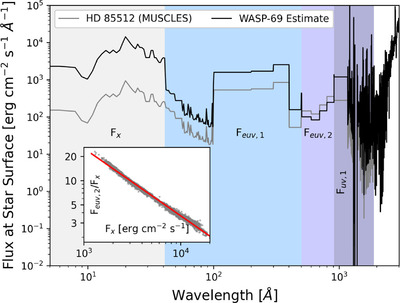
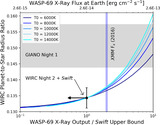
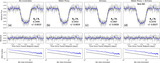
Caption: Figure 7.
The main plot shows the estimated WASP-69 spectrum (black line), which was established from Swift observations and scaling HD 85512's spectrum (gray line) to solar X-ray/UV flux ratios. Each bandpass of interest is shown with background shading. The inset shows the TIMED/SEE data from Solar Cycle 24 from the F x and F euv,2 bands along with the best-fit power law.
Other Images in This Article
Show More
Copyright and Terms & Conditions
© 2024. The Author(s). Published by the American Astronomical Society.
Copyright ©
2026 Astronomy Image Explorer. All Rights Reserved.