Image Details
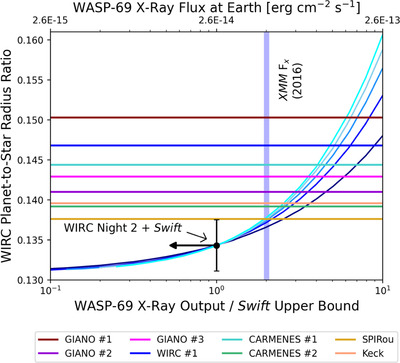
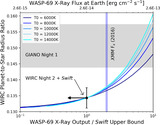
Caption: Figure 15.
Analogous plot to Figure 8 that includes all the WIRC-like metastable HeI transits instead of only the extreme values. For each WIRC-like metastable HeI light curve without contemporaneous XUV data, we display a horizontal line at the best-fit planet-to-star radii ratio from the joint fit in Section 3.3. Uncertainty bounds on the WIRC-like metastable HeI transit depths are not displayed on the plot but are presented in Table 3.
Other Images in This Article
Show More
Copyright and Terms & Conditions
© 2024. The Author(s). Published by the American Astronomical Society.
Copyright ©
2025 Astronomy Image Explorer. All Rights Reserved.