Image Details
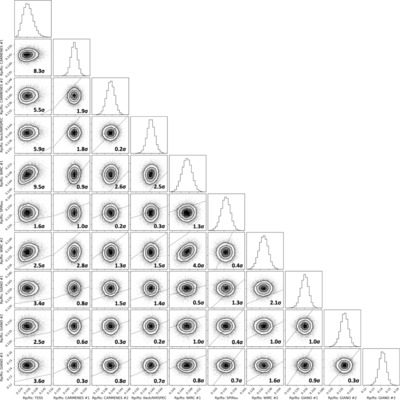
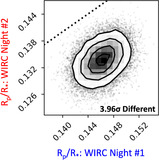
Caption: Figure 14.
Corner plot of the planet-to-star radii ratios for all light curves from the joint fit in Section 3.3 that included broadband TESS observations with metastable HeI data from both ultranarrowband photometry and spectroscopy. Each of the two-dimensional histograms is annotated with the difference (in σ) between the two parameters as derived from the posterior samples themselves. The dotted black line on each two-dimensional histogram indicates where the two radii are equal.
Other Images in This Article
Show More
Copyright and Terms & Conditions
© 2024. The Author(s). Published by the American Astronomical Society.
Copyright ©
2026 Astronomy Image Explorer. All Rights Reserved.