Image Details
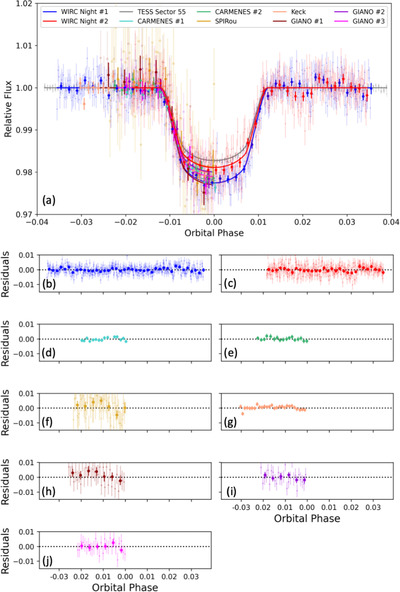
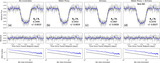
Caption: Figure 13.
Panel (a) shows the best-fit, phase-folded light-curve models from the procedure in Section 3.3. Panels (b), (c), (d), (e), (f), (g), (h), (i), and (j) show the residuals of the metastable HeI light-curve models vs. the best-fit light curve from panel (a). These residual plots correspond to WIRC night 1, WIRC night 2, CARMENES night 1, CARMENES night 2, SPIRou, Keck, GIANO night 1, GIANO night 2, and GIANO night 3, respectively; the legend in panel (a) also corresponds to the color-coding in panels (b)–(j). This figure is the analog of Figure 3 from Section 3.2 for the joint fit from Section 3.3.
Other Images in This Article
Show More
Copyright and Terms & Conditions
© 2024. The Author(s). Published by the American Astronomical Society.