Image Details
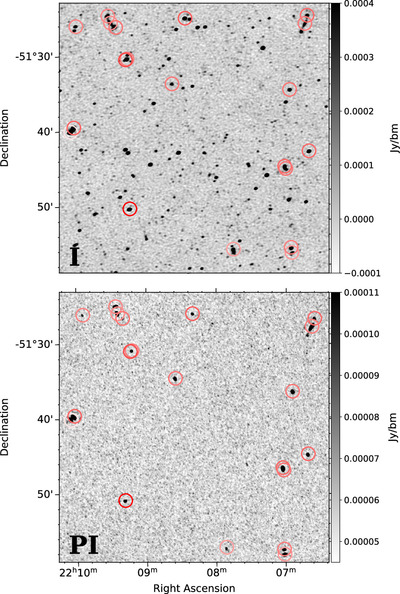
Caption: Figure 14.
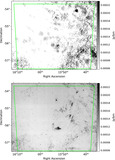
Top panel: total intensity image of a region of the EL observation. Polarized component RMs are indicated with circles with color corresponding to the sign and magnitude of the RM as described in Figure 13(c). Bottom panel: same as for the top panel but in peak polarized intensity.
Other Images in This Article
Show More
Copyright and Terms & Conditions
© 2024. The Author(s). Published by the American Astronomical Society.
Copyright ©
2025 Astronomy Image Explorer. All Rights Reserved.