Image Details
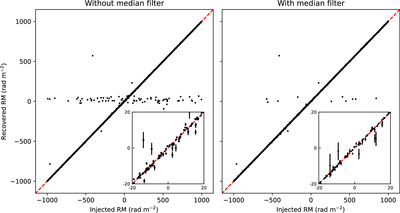
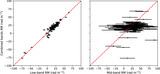
Caption: Figure 3.
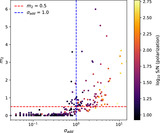
Left panel: recovered RM vs. injected RM for 5000 simulated compact components before applying the median filter. The red dashed line is the one-to-one line. The extreme outliers are components that are fainter than the local foreground diffuse emission. The inset is a close-up of ϕ ± 20 rad m−2. Right panel: same as the left panel but after applying the median filter. There is an 80% reduction in the most extreme outliers and an overall increase in the accuracy of the recovered RMs of all components.
Other Images in This Article
Show More
Copyright and Terms & Conditions
© 2024. The Author(s). Published by the American Astronomical Society.
Copyright ©
2025 Astronomy Image Explorer. All Rights Reserved.