Image Details
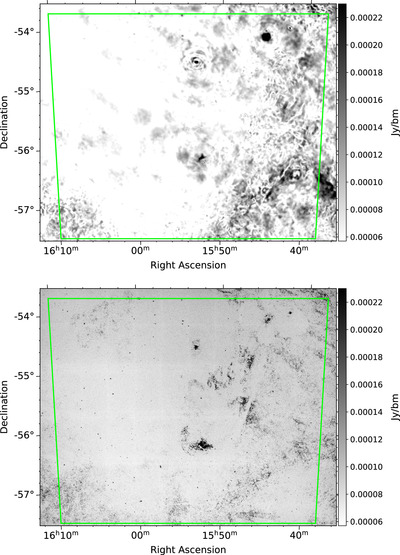
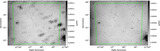
Caption: Figure 4.
Peak polarized intensity maps from the diffuse cubes (top) and component cubes (bottom) of the GL observation after applying a 120″ median filter. Faint residual diffuse emission can be seen in the component map, particularly on the right half of the image, where the diffuse emission or the polarization angle varies on smaller scales. The unfiltered peak polarized intensity map of the GL observation is shown in Figure 2.
Other Images in This Article
Show More
Copyright and Terms & Conditions
© 2024. The Author(s). Published by the American Astronomical Society.
Copyright ©
2025 Astronomy Image Explorer. All Rights Reserved.