Image Details
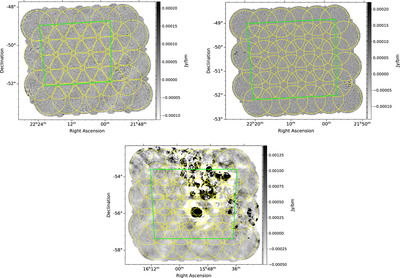
Caption: Figure 1.
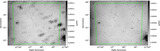
Total intensity images of the three observations analyzed in this paper. The yellow circles indicate the formed beam footprint, and the green rectangles outline our defined region of uniform sensitivity within which all analysis is performed. Top row: Pilot I EL observation (left) and Pilot I EM observation (right). Bottom row: GL Pilot II observation.
Other Images in This Article
Show More
Copyright and Terms & Conditions
© 2024. The Author(s). Published by the American Astronomical Society.
Copyright ©
2025 Astronomy Image Explorer. All Rights Reserved.