Image Details
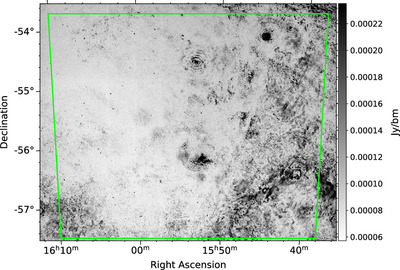
Caption: Figure 2.
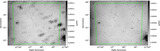
Peak polarized intensity map of the GL observation highlighting extensive diffuse emission present along the line of sight. The green box outlines the region of uniform sensitivity, as per Figure 1.
Other Images in This Article
Show More
Copyright and Terms & Conditions
© 2024. The Author(s). Published by the American Astronomical Society.
Copyright ©
2025 Astronomy Image Explorer. All Rights Reserved.