Image Details
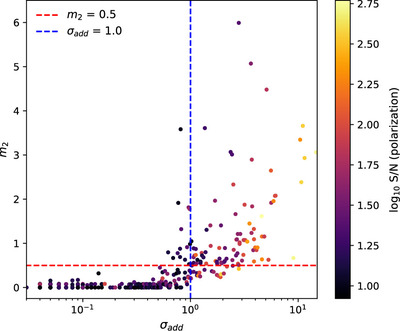
Caption: Figure 7.
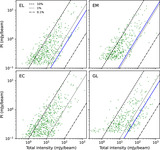
Comparison of the σ add and m 2 complexity metrics for polarized components in the median-filtered GL observation. The points are colored by log10(S/Npol), and the thresholds for complexity for both metrics are shown by dashed lines: σ add = 1 (blue vertical) and m 2 = 0.5 (red horizontal). Note that the σ add axis is on a log scale, while the m 2 axis is on a linear scale.
Other Images in This Article
Show More
Copyright and Terms & Conditions
© 2024. The Author(s). Published by the American Astronomical Society.
Copyright ©
2025 Astronomy Image Explorer. All Rights Reserved.