

Image Details
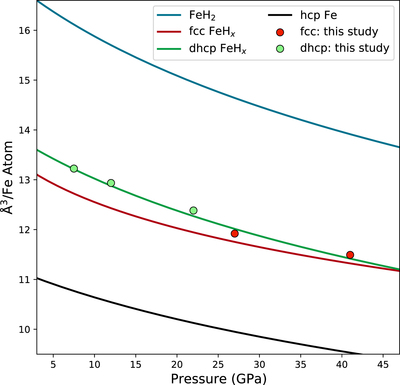
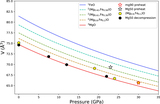
Caption: Figure A3.
Comparison of the volumes per Fe atom (V/Z) of Fe and Fe-H phases observed in our experiments and the volume previously reported at 300 K. Both the fcc and dhcp FeH x phases observed in this study (red and green circles, respectively) show V/Z consistent with 1:1 stoichiometric FeH (colored curves). Equations of state for hcp Fe, fcc FeH, dhcp FeH, and FeH2 are from Dewaele et al. (2006), Narygina et al. (2011), Pepin et al. (2014), and Pepin et al. (2014), respectively.
Other Images in This Article
Copyright and Terms & Conditions
© 2023. The Author(s). Published by the American Astronomical Society.

Copyright ©
2026 Astronomy Image Explorer. All Rights Reserved.
