

Image Details
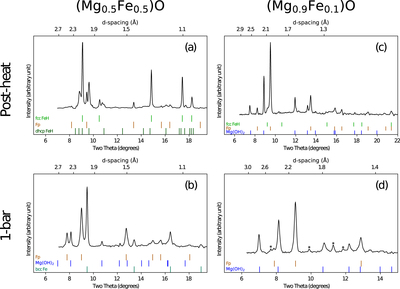
Caption: Figure 3.
X-ray diffraction patterns showing temperature-quenched samples at high pressure after their final heating event (first row), and materials after decompression to 1 bar (second row). Patterns shown along columns and their respective heating temperatures are from experiments Mg50-2 (2450 K) and Mg90-1 (<1000 K) respectively (Table 1). Phases marked “Fp” represent any phase of composition (Mg1−x Fe x )O, as in many cases after heating the exact composition is unknown since the sample has reacted with hydrogen and lost some amount of Fe through reduction. The starred peaks in pattern (d) are unassigned. These peaks did not exist after heating at high pressure but appear when the sample was pressure quenched to 1 bar. Therefore, they are not related to the high-temperature reactions we focus on in this paper. They are likely from possible conversions of the sample during pressure unloading.
Other Images in This Article
Copyright and Terms & Conditions
© 2023. The Author(s). Published by the American Astronomical Society.

