

Image Details
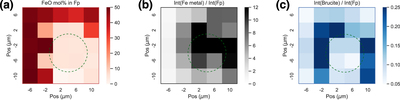
Caption: Figure 4.
2D X-ray diffraction map of the (Mg0.5Fe0.5)O sample heated in a pure H medium at 23 GPa and 2450 K. The mapping was conducted after the recovery of the sample at 1 bar and 300 K inside a diamond-anvil cell. The green dashed circle indicates the hot spot center. (a) Fe content in (Mg,Fe)O was calculated from the unit-cell volume using a linear relationship between the volume and the Fe content (Jackson & Rigden 1996). (b) Intensity ratio between Fe metal (bcc converted from FeH x ) and (Mg,Fe)O. (c) Intensity ratio between brucite and (Mg,Fe)O.
Other Images in This Article
Copyright and Terms & Conditions
© 2023. The Author(s). Published by the American Astronomical Society.

Copyright ©
2026 Astronomy Image Explorer. All Rights Reserved.
