

Image Details
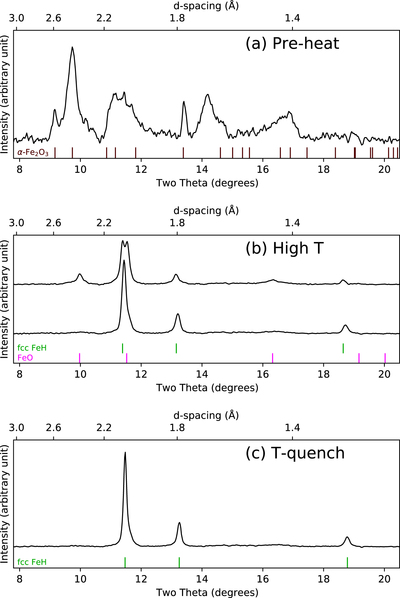
Caption: Figure 2.
X-ray diffraction patterns from run Hem-4 (Table 1) taken at 38 GPa (a) before heating, (b) during heating (∼1850 K), and (c) after heating. The upper pattern in panel (b) is during the first heating event, and the lower pattern is during the final heating event. The vertical tick marks below each integrated diffraction pattern represent the diffraction peak positions of the various observed mineral phases. Expected peak positions are calculated by combining the experimentally determined crystal structure and equation of state for a given material. Initially both FeO and FeH x were formed, but after four heating events only FeH x was observed in diffraction patterns.
Other Images in This Article
Copyright and Terms & Conditions
© 2023. The Author(s). Published by the American Astronomical Society.

