Image Details
Caption: Figure 9.
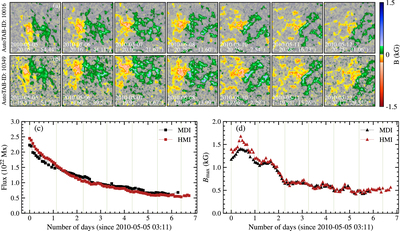
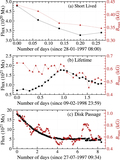
Snapshot of a tracked BMR with NOAA AR11068 during its passage on the observable disk as observed in (a) HMI and (b) MDI. Panels (c) and (d) show the variations of the total flux and B max, respectively, obtained from both data sets. Vertical lines in panels (c) and (d) represent the times corresponding to the snapshots shown in panels (a) and (b), respectively.
Other Images in This Article
Copyright and Terms & Conditions
© 2023. The Author(s). Published by the American Astronomical Society.
Copyright ©
2025 Astronomy Image Explorer. All Rights Reserved.