Image Details
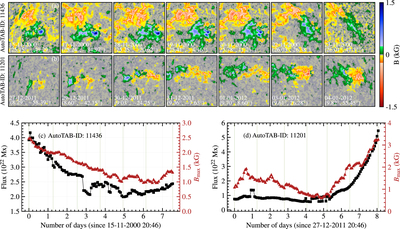
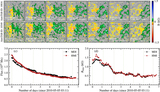
Caption: Figure 3.
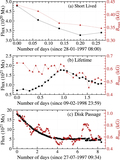
Panels (a) and (b) show the snapshots of the tracked BMRs with AR9232 (AutoTAB-ID 11436) and AR11390 (AutoTAB-ID 11201), respectively, corresponding to each day during the tracking. Panels (c) and (d) show the evolution of the absolute total flux and ﹩{B}_{\max }﹩ for these BMRs. The vertical lines in panels (c) and (d) represent the times corresponding to the time of the snapshots shown in panels (a) and (b), respectively.
Other Images in This Article
Copyright and Terms & Conditions
© 2023. The Author(s). Published by the American Astronomical Society.
Copyright ©
2025 Astronomy Image Explorer. All Rights Reserved.