Image Details
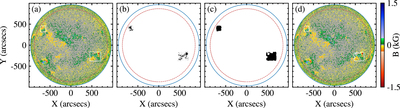
Caption: Figure 1.
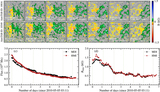
(a) Magnetogram from MDI for 2000 November 15 20:48 with detected BMRs represented by white rectangular boxes. (b) Binary mask of detected BMRs from panel (a), but after applying the threshold of 100 G to the detected regions. (c) Same as panel (b) after the preprocessing (described in Section 2.2). (d) Identified regions after the preprocessing depicted on the magnetogram. The solid blue and dashed red circles represent 1.0 R ⊙ and 0.9 R ⊙, respectively.
Other Images in This Article
Copyright and Terms & Conditions
© 2023. The Author(s). Published by the American Astronomical Society.
Copyright ©
2025 Astronomy Image Explorer. All Rights Reserved.