Image Details
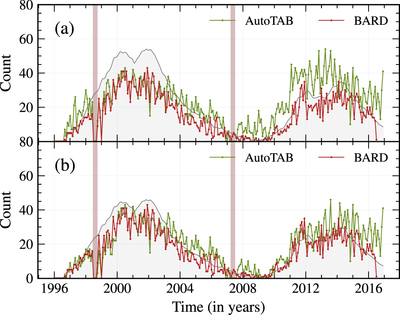
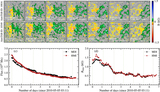
Caption: Figure 8.
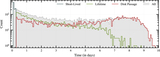
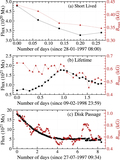
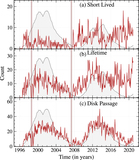
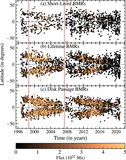
(a) Comparison of the monthly number of newly emergent BMRs obtained from AutoTAB (our algorithm) and BARD, along with the traditional monthly sunspot number (gray shaded area enclosed by line). The sunspot number has been multiplied by a factor of 0.6 to bring it to the scale of the BMR count. The vertical strips in the figure represent the data gaps in MDI magnetograms. (b) Same as panel (a), but only including the BMRs from DP class, which has a lifetime of greater than 1 day and the 500 G threshold applied to BMRs from MDI in the AutoTAB data set.
Other Images in This Article
Copyright and Terms & Conditions
© 2023. The Author(s). Published by the American Astronomical Society.
Copyright ©
2025 Astronomy Image Explorer. All Rights Reserved.