Image Details
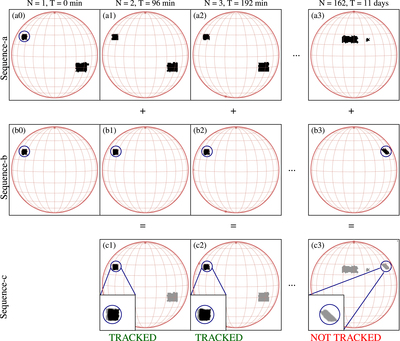
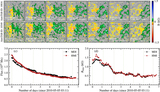
Caption: Figure 2.
Representative example of the BMR tracking algorithm. The BMR intended to be tracked is marked by a circle. (a0), (a1), (a2), and (a3) represent the selected binary maps in Sequence-a. (b0), (b1), (b2), and (b3) represent Sequence-b, the isolated and differentially rotated binary masks of the BMR, corresponding to the time of observation in Sequence-a. (c1), (c2), and (c3) represent Sequence-c, obtained by adding Sequence-a and Sequence-b. The zoomed-in view of the overlapping region is shown in the inset.
Other Images in This Article
Copyright and Terms & Conditions
© 2023. The Author(s). Published by the American Astronomical Society.
Copyright ©
2025 Astronomy Image Explorer. All Rights Reserved.