Image Details
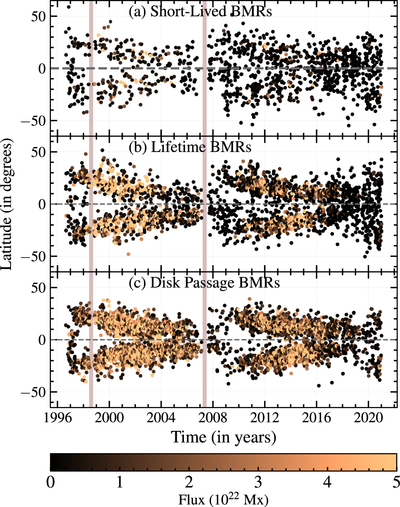
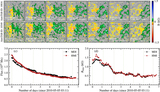
Caption: Figure 7.
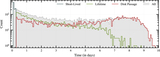
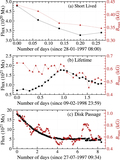
Latitude–time distribution (butterfly diagram) of the tracked BMRs of (a) SL, (b) LT, and (c) DP classes. The color of the points represents the total flux of the BMR. The vertical strips represent the data gaps in MDI magnetograms.
Other Images in This Article
Copyright and Terms & Conditions
© 2023. The Author(s). Published by the American Astronomical Society.
Copyright ©
2025 Astronomy Image Explorer. All Rights Reserved.