Image Details
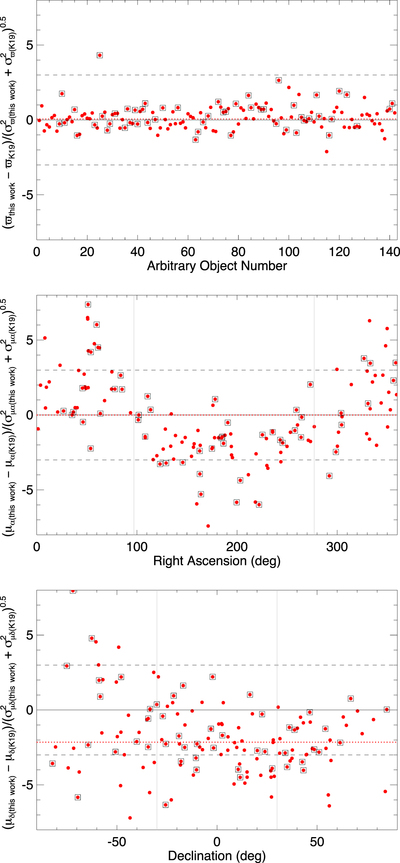
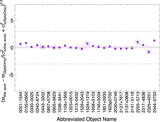
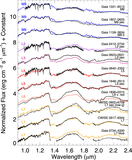
Caption: Figure 4.
Comparison of astrometric results from this paper to those presented in Kirkpatrick et al. (2019a) (“K19” in the labels) for the 142 objects (red points) in common. The y-axis, which shows the difference between the measurements divided by the root-sum-square of the uncertainties in those measurements, indicates the discrepancy between the two values in units of the combined σ. Mean offsets along the y-axis are shown by the dotted red line; the dashed black lines show 3σ excursions. Vertical lines in the bottom two panels mark the R.A. and decl. values of the solar apex and antapex. Objects with ﹩{\chi }_{\nu }^{2}﹩ values of 1.5 or greater are marked by squares and are not included in the computation of the mean. For ease of comparison across figures, the vertical scale is kept constant for Figures 4–8.
Other Images in This Article

Show More
Copyright and Terms & Conditions
© 2021. The American Astronomical Society. All rights reserved.