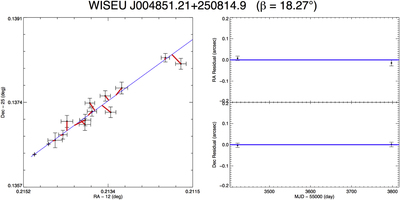
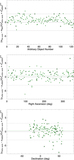
Image Details

Choose export citation format:

The Field Substellar Mass Function Based on the Full-sky 20 pc Census of 525 L, T, and Y Dwarfs

  • Authors: J. Davy Kirkpatrick, Christopher R. Gelino, Jacqueline K. Faherty, Aaron M. Meisner, Dan Caselden, Adam C. Schneider, Federico Marocco, Alfred J. Cayago, R. L. Smart, Peter R. Eisenhardt, Marc J. Kuchner, Edward L. Wright, Michael C. Cushing, Katelyn N. Allers, Daniella C. Bardalez Gagliuffi, Adam J. Burgasser, Jonathan Gagné, Sarah E. Logsdon, Emily C. Martin, James G. Ingalls, Patrick J. Lowrance, Ellianna S. Abrahams, Christian Aganze, Roman Gerasimov, Eileen C. Gonzales, Chih-Chun Hsu, Nikita Kamraj, Rocio Kiman, Jon Rees, Christopher Theissen, Kareem Ammar, Nikolaj Stevnbak Andersen, Paul Beaulieu, Guillaume Colin, Charles A. Elachi, Samuel J. Goodman, Léopold Gramaize, Leslie K. Hamlet, Justin Hong, Alexander Jonkeren, Mohammed Khalil, David W. Martin, William Pendrill, Benjamin Pumphrey, Austin Rothermich, Arttu Sainio, Andres Stenner, Christopher Tanner, Melina Thévenot, Nikita V. Voloshin, Jim Walla, and Zbigniew Wędracki

2021 The Astrophysical Journal Supplement Series 253 7.

  • Provider: AAS Journals

Caption: Figure 3.

Example of a target whose astrometric fit uses both Spitzer and unWISE data, but for which a parallactic fit could not be attempted. (Left) A square patch of sky showing the measured astrometry and its uncertainty at each epoch (black points with error bars) plotted in R.A. vs. decl. Points with small error bars are the Spitzer ch2 measurements; those with larger error bars are the WISE W1 and W2 measurements. Blue curve shows the best proper motion fit. Red lines connect each observation to its corresponding time point along the best-fit curve. (Right) The R.A. and decl. residuals from the fit as a function of time. Only the Spitzer data are shown, since the error bars of the WISE points would otherwise dominate the plot.

Other Images in This Article

Show More

Copyright and Terms & Conditions